Alberta 2023: Post-Election Panel – What’s Next for Alberta.
Join our team of multi-partisan political insiders, journalists, and special guests to learn what happened, why it happened, and what’s next for the winners and losers of the May 29 election.
The panel includes a special presentation by Adrian Macaulay, Counsel’s opinion research director.
- When: Join us on Zoom – Thursday, June 1 – 12 pm (MST) / 2 pm (EST)
- For more information: click here.
- RSVP: click here.
—
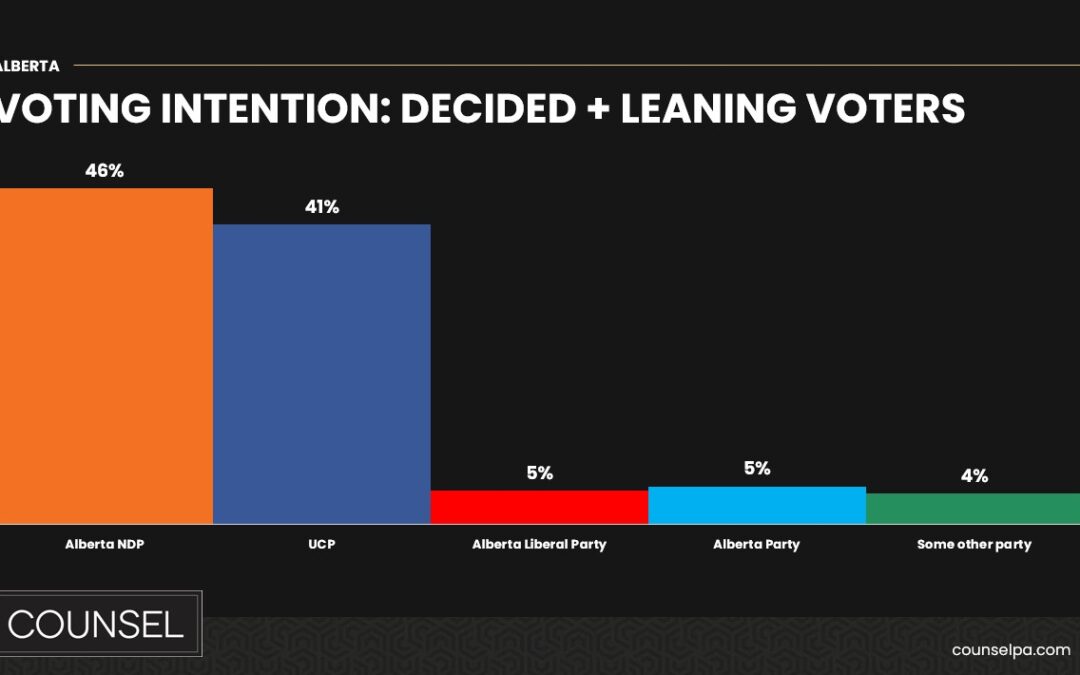
The race continues to be close, with decided and leaning voters slightly favouring the NDP with 46%, over the UCP (41%).
May 27, 2023 – In the last few days of one of the most unique campaigns in Alberta history, Counsel Public Affairs went into the field to capture the voting intentions of Albertans.
Our latest public polling release includes: voter intention, regional breakdown, and advance poll insights.
Counsel’s most recent survey was conducted between Thursday, May 25, and Friday, May 26, and had a sample size of 1,232 respondents.
In the lead-up to the May 29 Alberta election, Counsel Public Affairs has been actively measuring the opinions, attitudes, and voting intentions of Alberta residents since March of this year.
Key Findings:
- The race continues to be close. Decided and leaning voters slightly favour the NDP (46%) over the UCP (41%) and other parties currently at (14%).
- The NDP lead the advance polls with 43% to the UCP’s 35%.
- The NDP is leading Edmonton with 37% and UCP at 22%.
- In Calgary, the NDP (33%) has a slight lead over the UCP (28%).
- Undecided voters are leaning toward the UCP with 24%, and the NDP is not far behind with 20%.
- 10% of respondents have already voted in the advance polls.
Methodology for May 25 – 26, 2023 Survey
1,232 Alberta residents were surveyed between May 25 – May 26, 2023. Counsel Public Affairs uses the Lucid Exchange Platform as the sample provider, which blends a variety of partner panels. If the survey was a probability-based random sample of the same size, it would be considered accurate +/- 3% nineteen times out of twenty. Results are weighted for age, gender, education, and region according to the most recent census. The survey was self-commissioned and paid for by Counsel Public Affairs.

